 |
|
 |
|
| |
 FOOD & BEVERAGES
All Food & Beverages outlets face lots of operational business challenges and look to counter them through various methods, but primary among them is the constant challenge of aggregating key business information being gathered in multiple systems and making business sense out of them.
Business owners and managers at Food & Beverage companies understand that some crucial indicators like Waste %, table capacity utilization, Menu FSN items, and supplier fill rates are extremely key to their growth and profitability.

THE CONVENTIONAL APPROACH
Conventional methods of writing out or collating reports for logistics from disparate systems are time consuming for
users and are usually not available for top management in real time.
This not only impacts productivity of the entire organization, it also requires lot of efforts.
Moreover, these conventional methods are also error prone and person dependent.

THE MAGNISS SOLUTION
Performance improvement of logistics companies is attained through constant review of key business information that is conventionally
made available through aggregating information made available to senior management by users extracting data from multiple systems.
Improving efficiency through improving a company's logistics performance index (LPI) will be a critical determinant in the measurement of productivity enhancement in Singapore based logistics companies.
At Magniss, we have designed an innovative IT solution that helps top management of logistics companies perform
real-time business analytics by extracting data from multiple systems.
The Magniss logistics solution provides the managers and top management users relevant logistics KPIs through a
simple-to-use logistics dashboard that showcases all the KPIs relevant to the industry in a simple and
user-friendly interface.
The users of the system get periodic business alerts and information alerts that can be quickly acted upon thereby
improving productivity and improving efficiency.
Magniss solution offers a world-class BI system that has preconfigured BI tools and BI software for easy and
quick tracking of their company's key performance indicators or KPI through a KPI dashboard.
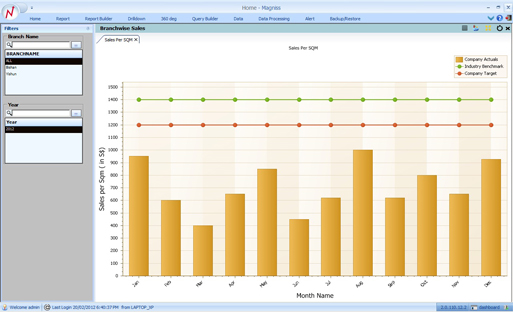
Some of the KPIs that are available as a part of the standard dashboard module for Marine logistics
industry is shown below.
If you are a business owner / manager in a logistics company based out of Singapore, do not hesitate
to call us or any one of our partners for a detailed demonstration of our product and showcase how it can help you
‘get more’ growth, efficiency and profitability in your business.
|
|
|
Key Performance Indicators |
| |
|
|
 |
Supplier fill rate
It can be pretty embarassing when an item is on the menu and there are no ingredients to prepare that item when there is a customer order.... one way to ensure it does not happen in an F & B outlet is ensure that the supplier fill rates are near 100%. Hence, ensuring a higher supplier fill rate ensures that you have lesser instances of 'walkout' customers, ensuring margins and also customer retention.
Sales Distribution Ratio
This shows the customer payment mode comparison between cash, credit and loyalty coupon sales, giving the store management an idea of effectiveness of their various campaigns, if any and also indicating customer preference of a particular mode of purchase.
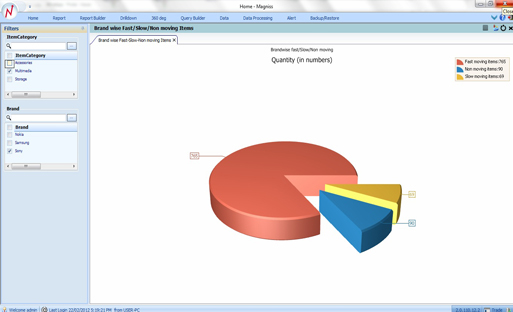
FSN
FSN - or Fast, Slow and Non-moving items analysis, helps you quickly zero-in on the non-moving items and ensuring that the respective managers find a way of selling or moving them out of of your warehouse. Similarly slow / non-moving menu items can be tracked and modified / removed from the menu list periodically to ensure that the outlet stays in tune with customer preferences.
|
|
|
| |
|
|
|
| |
|


